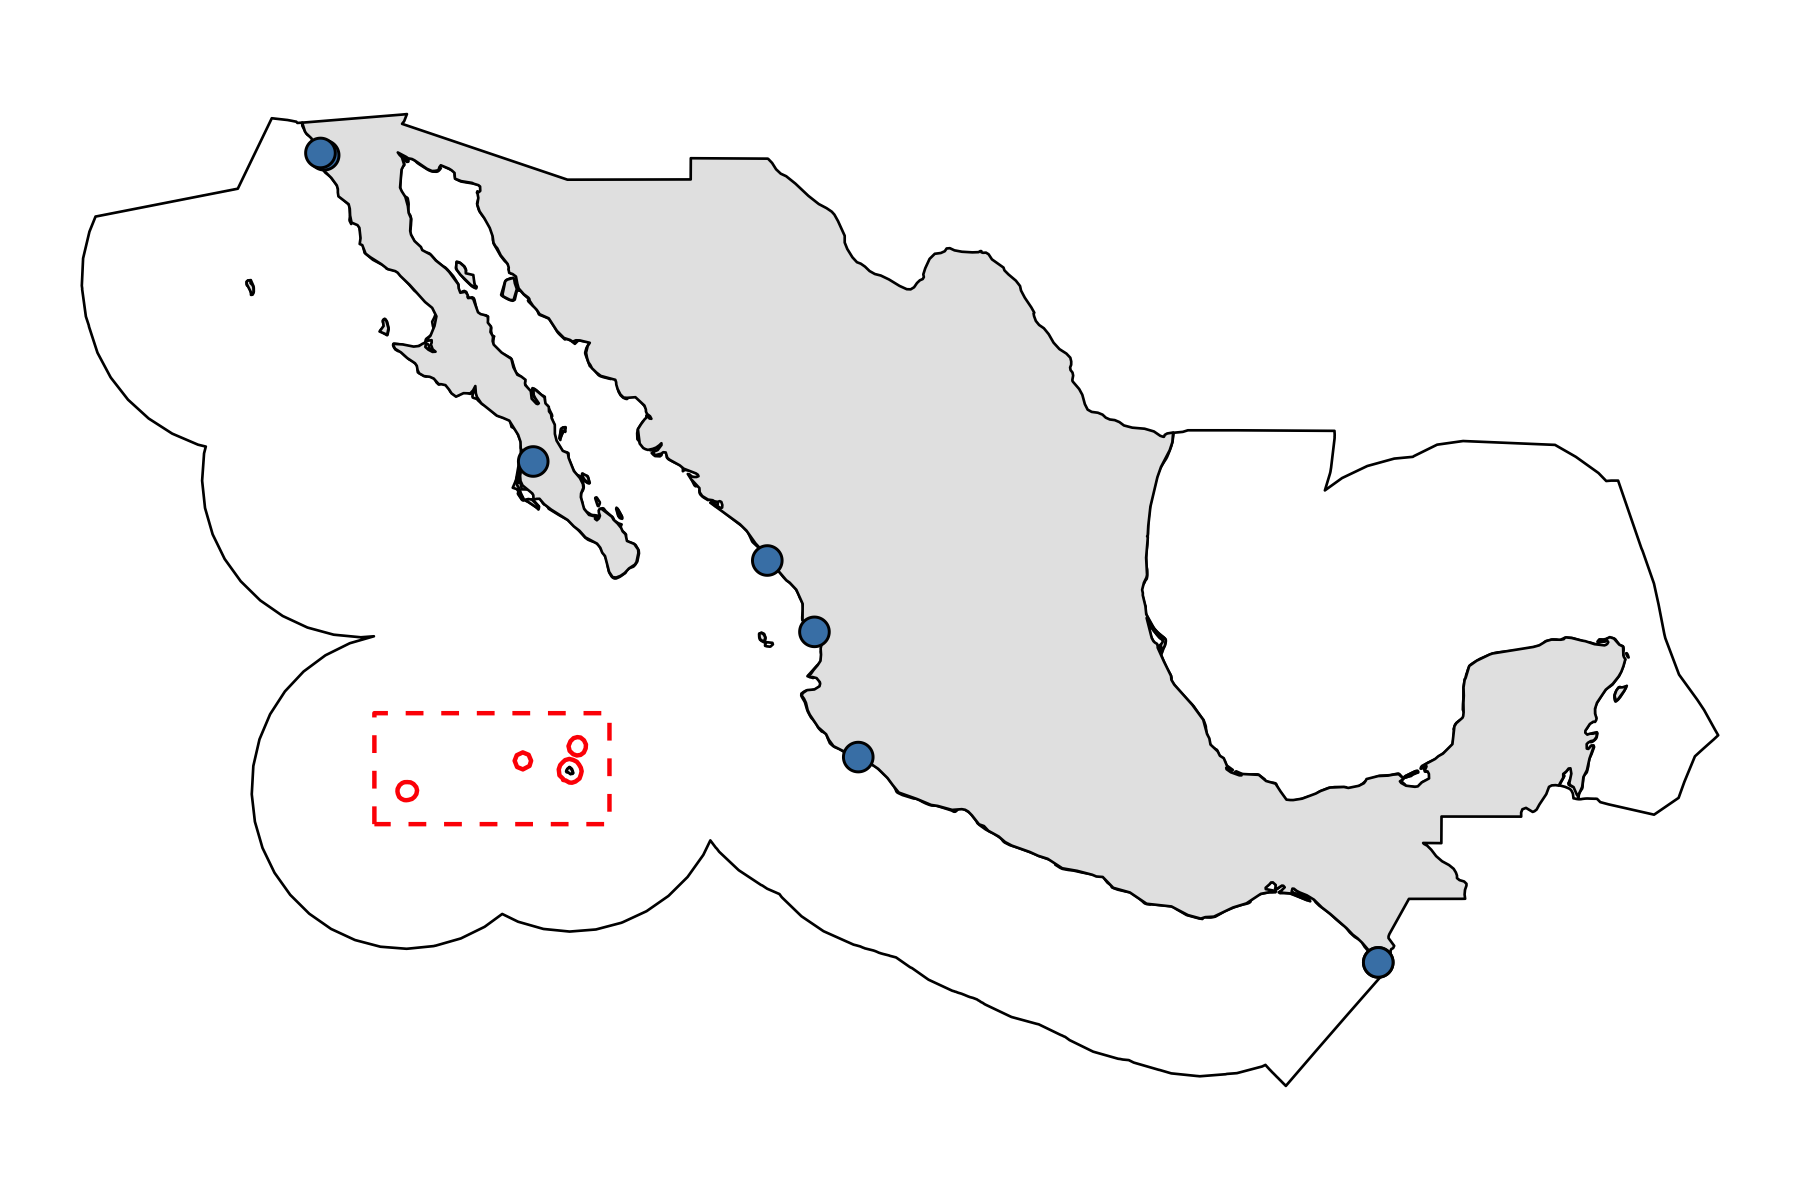
I am interested in understanding the distributional impacts of Marine Protected Areas. I explore this question in the context of the Mexican Tuna Purse Seine fishery and the Revillagigedo MPA. The tuna fishery is Mexico’s second largest fishery by volume (after sardine) and value (after shrimp). This project involves some heavy data lifting. Revillagigedo accounts for nearly 97\% of Mexico’s no-take zone area.
Data
I use three sources of admnistrative data from the Mexicna fisheries agency: vessel-tracing data, vessel registries, and landings data.
Vessel-tracking data
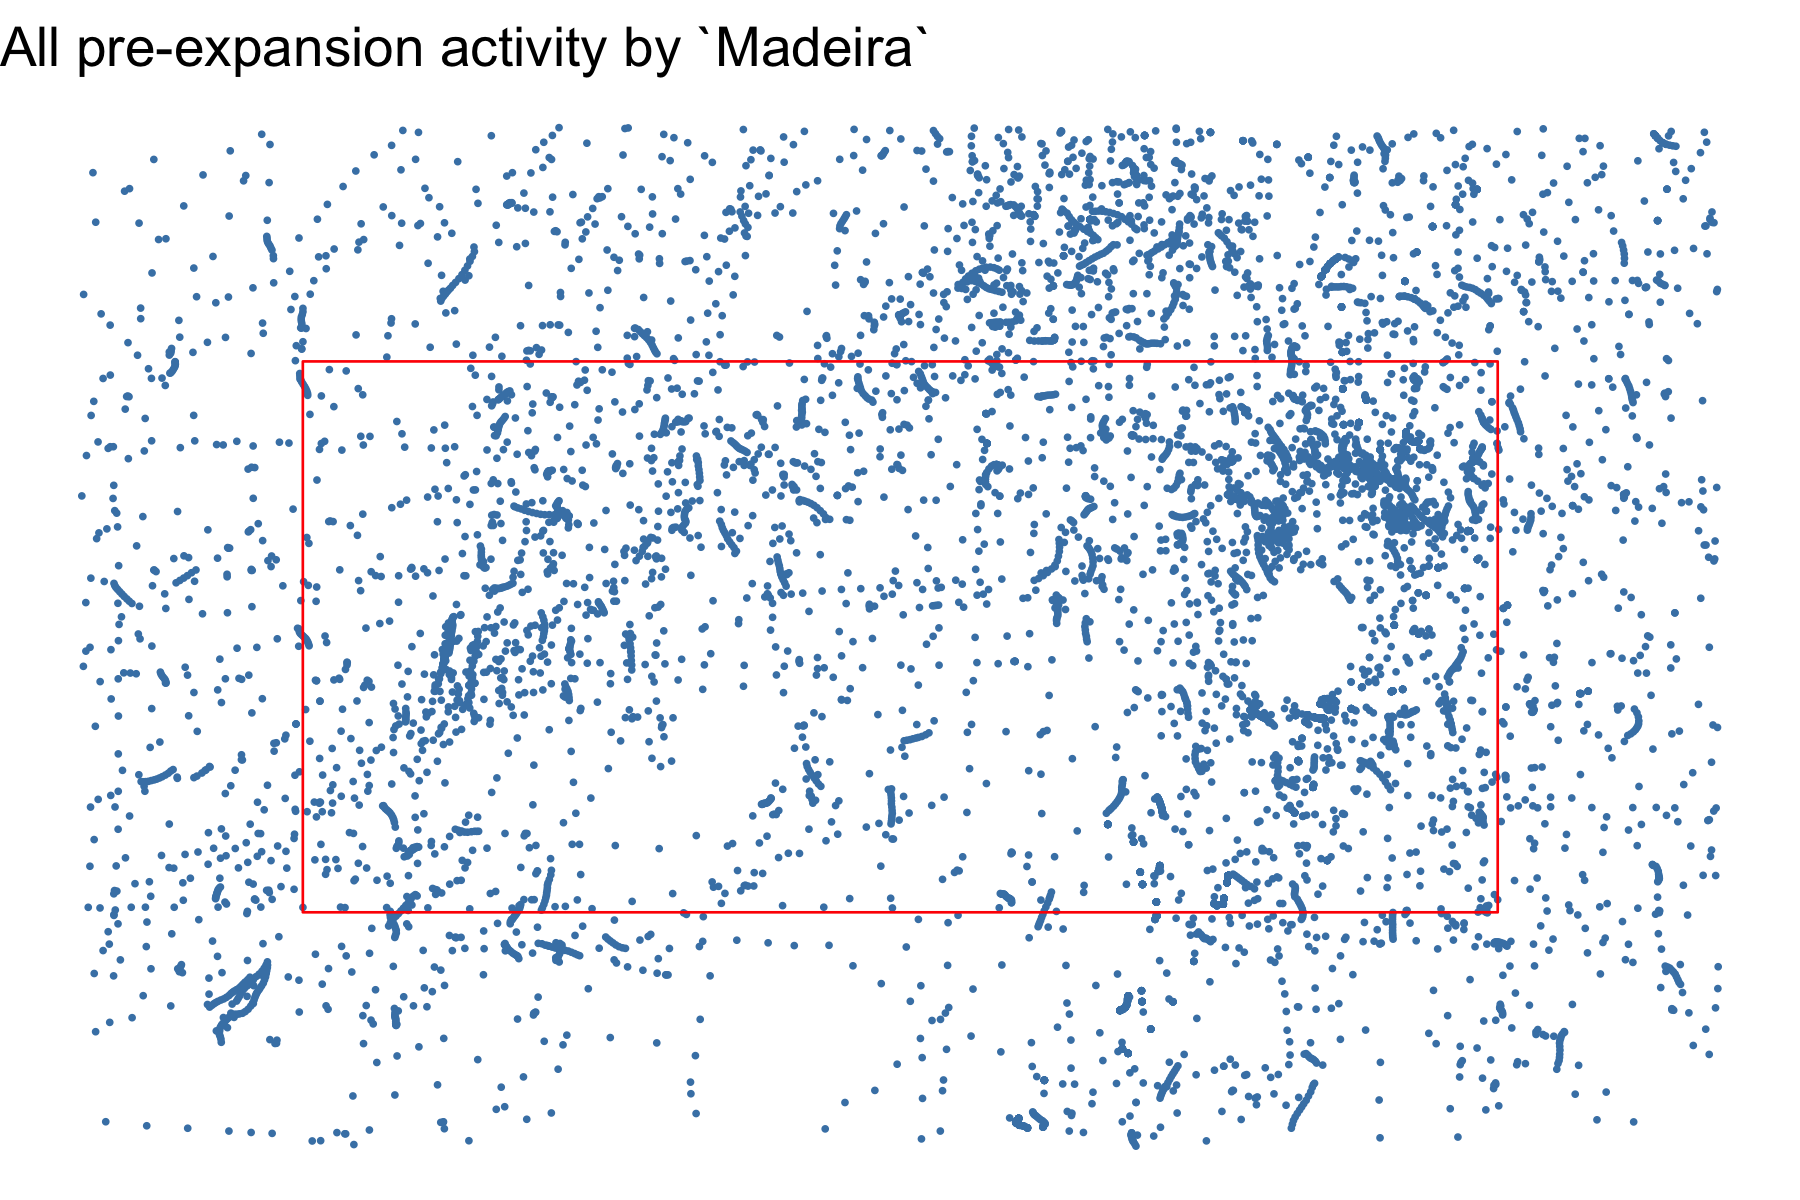
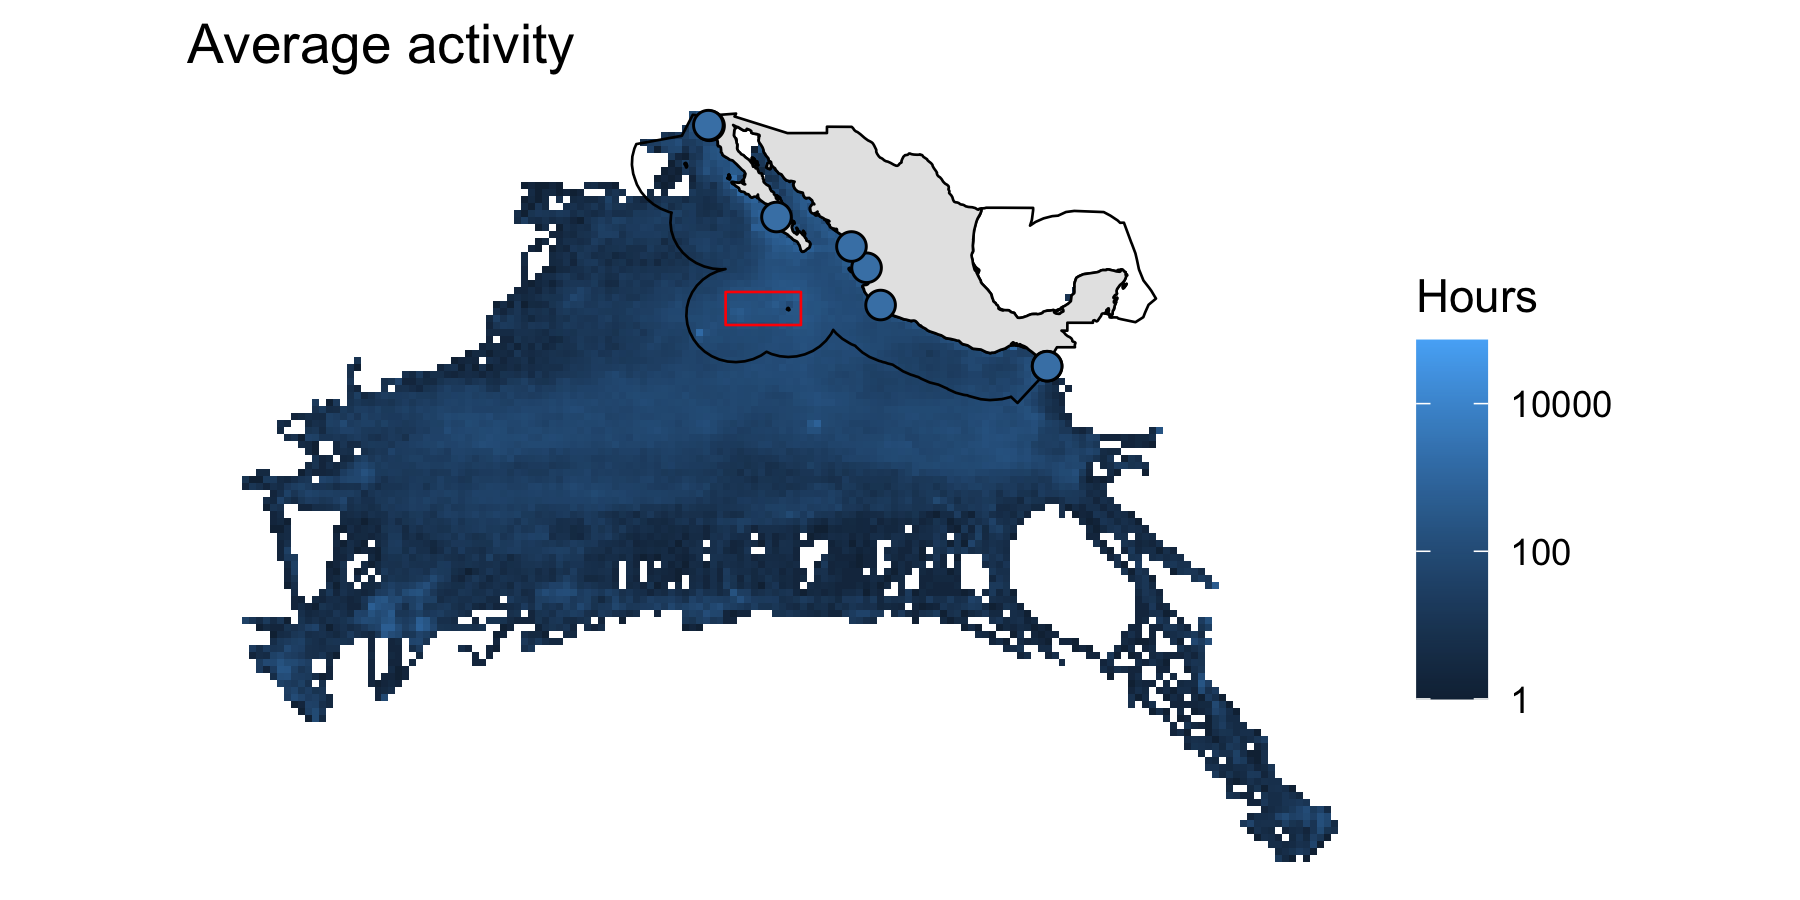
The Mexican government employs vessel monitoring systems to track fishing activity in real time. A lagged version of these data (often by a couple of months) is publicly available though their “Transparency in Data portal”, giving public access to the hourly positions of more than 2,000 fishing vessels from 2007 to present. Specifically, these data report a unique vessel identifier, timestamp, geographic position, speed and course for once per hour for every vessel. I cleaned the data locally, and then hosted them on Google CloudStorage and imported to BigQuery, creating the first of three tables that will make part of the relational database. These data can be rasterized and used to evaluate the interaction between the MPA and fishing activity before and after the MPA was implemented (See Figure below for a “before” snapshot). But, importantly, we can track individual vessels, allowing us to look at vessel-level impacts.
Vessel registry
The Mexican NGO CausaNatura works to promote access and transparency to administrative data. As part of their efforts, they have made available. These data include important vessel characteristics, such as length, engine power, crew size and, importantly, target species. Similarly, these data are cleaned using a series of standardized string normalization functions as part of my personal R-package.
Landings data
We use data form landing tickets reported to CONAPESCA between 2001 and 2019, which report the species or broad group of species (sometimes the record might indicate “yellowtail jack” and sometimes simply “jack”“), type of landed catch (e.g. total weight or gutted weight), amount (in Kg) and value (in Mexican Pesos; MXP).
Data processing
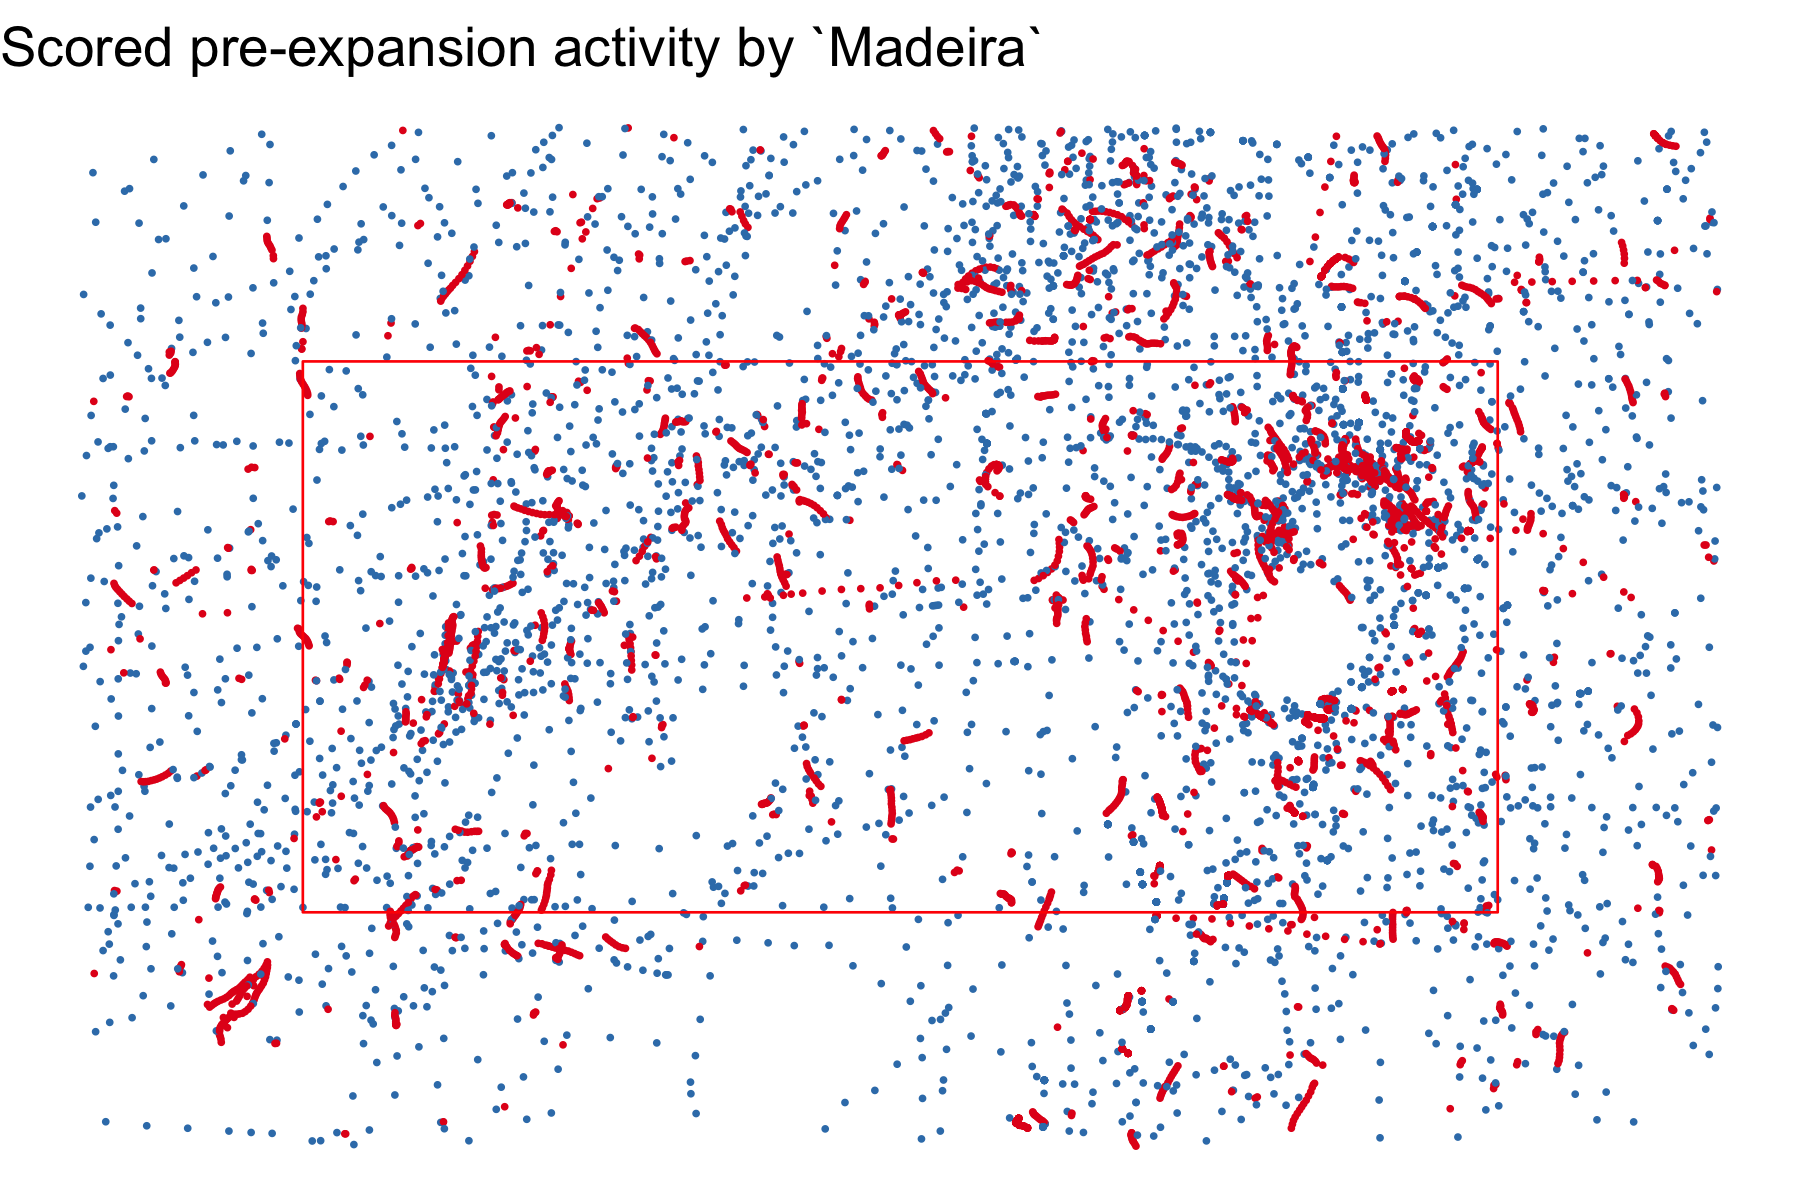
I match vessels across these three tables and produce a spatio-temporal dataset of location, vessel characteristics, and landings for all Mexican tuna purse seiners. I then use these data in combination with unsupervised machine learning (supervised version coming soon!) to differentiate fishing from non-fishing positions. On the figure below, one shows all raw positions for 1 vessel during for all year before the MPA was implemented (the red polygon represents Revillagigedo MPA). The second figure shows the same data, after each point has been scored as “fishing” or “not fishing”.